上報 Up Media
toggle- 最新消息 台股跳水!盤中一度重挫逾900點 台積電因「法說會效應」一度爆跌52元 2024-04-19 11:26
- 最新消息 【有片】巴勒斯坦申請成為聯合國正式會員 遭美國否決 2024-04-19 11:20
- 最新消息 保母妹妹當庭推罪給姊姊 證據揭她痛扁凱凱還嘲笑「過太爽、繼續打」 2024-04-19 11:15
- 最新消息 顏寬恒否認沙鹿豪宅竊佔國土 檢方斥牟利卸責應從重量刑 2024-04-19 10:45
- 最新消息 中國無預警啟用M503兩條西向東航路 國台辦稱緩解航班壓力 2024-04-19 10:38
- 最新消息 快訊/以色列對伊朗發射飛彈報復反擊 伊斯法罕上空傳爆炸聲 2024-04-19 10:27
- 最新消息 快訊/內閣第4波人事公布 氣象達人彭啟明接環境部、何佩珊掌勞動部 2024-04-19 10:06
- 最新消息 永續再製!HOLA 世界地球日限定「迪士尼黑標米奇」開賣 2024-04-19 10:00
- 最新消息 直播/賴內閣第四波名單公布 卓榮泰10:00記者會 2024-04-19 09:50
- 最新消息 國家人權博物館展示典藏大樓修增建工程啟動 舉行開工典禮 2024-04-19 09:37


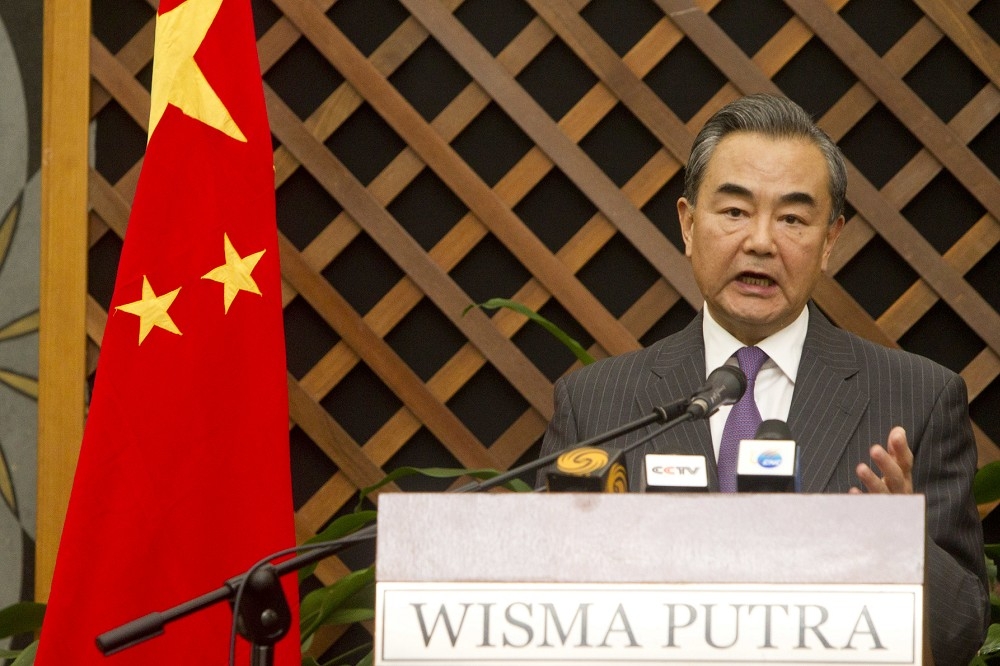
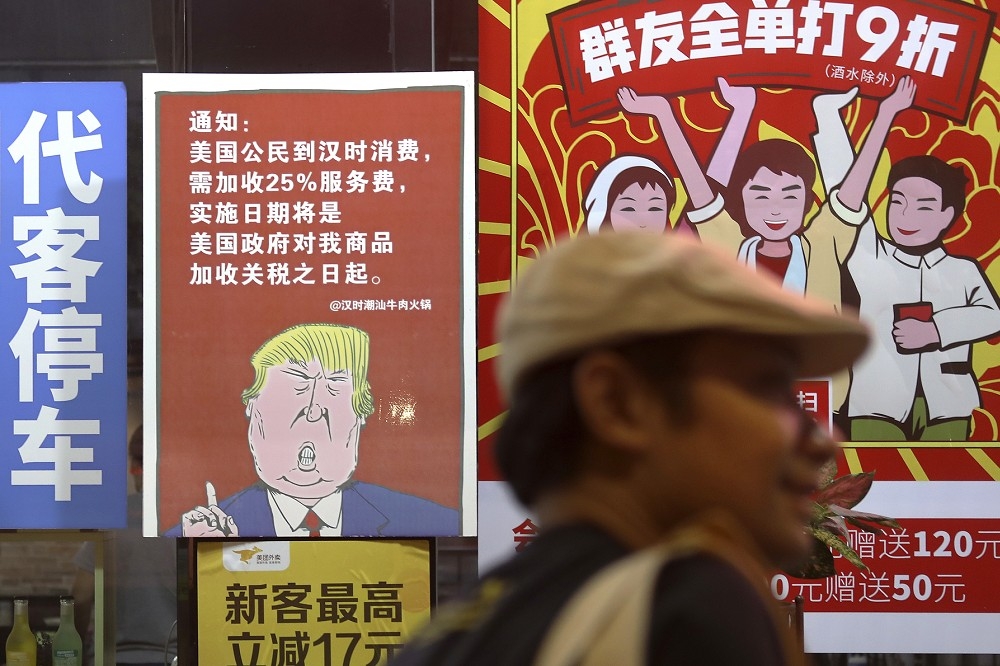
中國已不再是共產國家,但也還未進入資本社會,或許較準確的說法,應是一個頗具公有制特色的混合經濟體。(美聯社)
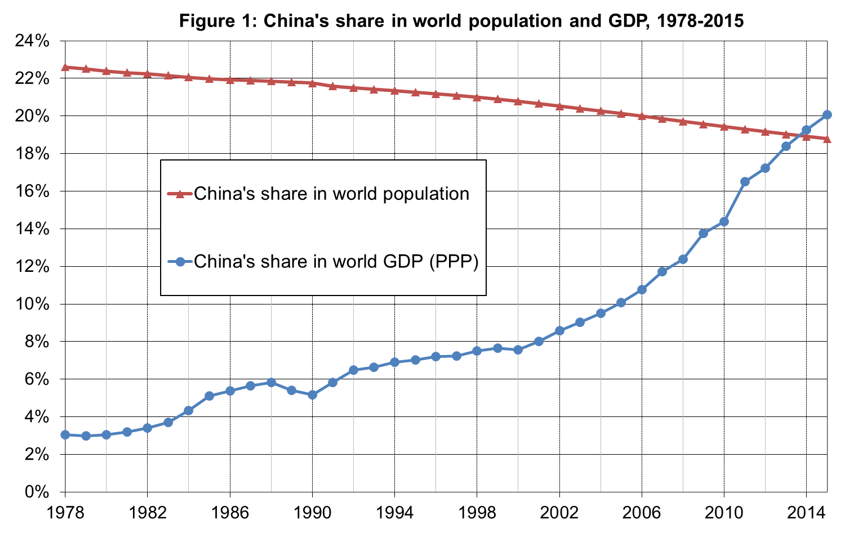
1978年的中國僅是個貧窮、低度開發的國家,但到了2015年卻已是世上數一數二蓬勃發展的新興經濟體。這數十年以來,中國占世界人口比雖然有所下降,但其GDP占世界經濟的比例卻是一路上升,1978年時僅不到3%,但2015年已增長至20%左右(見圖1)。
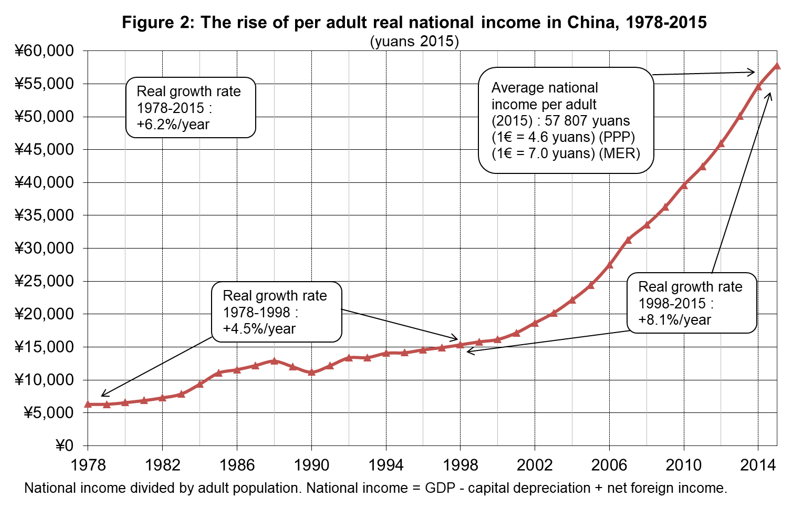
根據官方統計,1978年至2015年間,中國成年人口的實質人均所得足足增幅了八倍之多。1978年時,他們每月的國民平均所得僅120歐元(以2015年匯率計算),但時至2015年,此數字卻已突破每月1000歐元(見圖2) 註更多中國成年人每年的人均國民所得(annual per adult national income)在1978年為6500元人民幣,到2015年後升至57800元人民幣,若以2015年人民幣與歐元的購買力平價(purchasing power parity)匯率計算,則1978年約為1400歐元,而2015年約為12500歐元。。
然而,相較於國民所得,中國於此段關鍵時期的所得及財富分配有何變化,卻是比較鮮為人知。確切來說,儘管這數十年來,中國的總體經濟大幅起飛,但不同所得和財富群體究竟有沒有受益於此,各界一直未見準確一致的估算數據。
事實上,用於研究中國財富分配情況的家庭收支調查,多會碰上大量漏報情事,尤其是頂層群體更是如此,而這些調查也往往與用以評估總體經濟成長的資料來源(即national accounts;國民經濟會計帳)有所出入。這一議題不只對中國及其未來的發展道路來說意義重大,對於世界其他國家和全球化的社會永續性(social sustainability)也是極為重要。
財富累積(1978-2015)
皮凱提(Thomas Piketty)、楊利及祖克曼(Gabriel Zucman)等人近來發表研究,其中綜整官方及非官方的資料來源(包括針對中國財務狀況的獨立估算),提供了自中國改革開放以來首個嚴謹的估算報告,勾勒出中國國民財富的結構及水準情況。
時序回到1978年,中國踏上了一條轉型之路,由政府管制把關,一步步引入資本主義的元素,而非一下子便從企業國有的計畫經濟,轉為私人企業當道的市場經濟。此一轉型過程雖是穩健推展,但卻無可避免地涉及各個層面的改革行動,政府先於沿海城市設置特別經濟區,隨後慢慢轉向內陸省分,並且依照行業不同,開放時間也有差異。
此次轉型為中國帶來私有財富大幅增長,其相對於國民所得的比值日益升高,也就是所謂的私有財富/所得比(private wealth-income ratio)。自1978年改革開放以來,中國的私有財富/所得比到2015年已增至490%,成長近五倍之多(見圖3)。
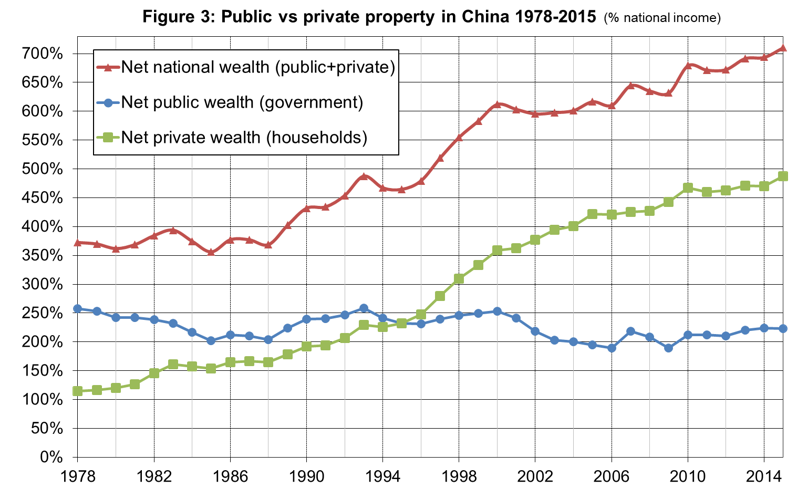
另一方面,中國公有財富相對於國民所得的比值,意即公有財富/所得比(public wealth-income ratio),自1978年起便穩定維持於250%左右。此消彼長之下,公有財富占國民財富的比例自然一路下降,1978年雖仍占70%左右,但到了2015年僅剩下約30%。時至今日,超過95%的住宅存量(housing stock)都已為私人家庭所有,要是換作1978年,這個數字則僅有50%左右而已。
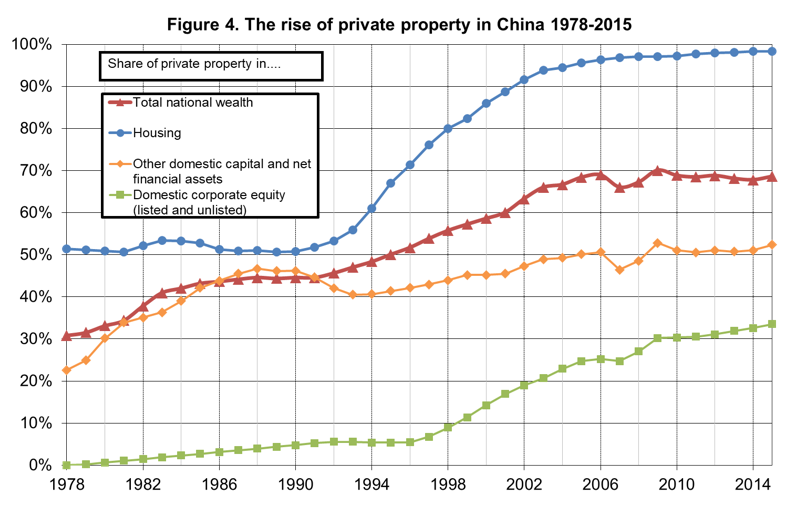
然而,中國企業仍多屬國有,政府方面掌握了近60%的企業股權(自2009年以來顯現小而顯著的回升),國內私人企業主擁有30%股權,剩下的10%則屬於外資--比例少於美國,更少於歐洲(見圖4)。
有趣的是,許多高所得國家從1980年代起,也歷經了公共財產占比下降的情況,這其中除了公債因素,也受到公共資產私有化的影響。中國現今的公有財富比例相較於「混合經濟」(mixed economy)時期(1950-1980)的西方高所得國家,差距並沒有過大。
事實上,中國目前30%的公共財產比雖高於該時期的西方國家(約15%-25%),但是差距也沒有那麼驚人。不僅如此,有些西方國家的公共財產在國民財富中的占比已經降至0%,甚至因為公債高於公共資產,導致此一占比低於0%,譬如美國、英國、日本和義大利等國。而中國在2008年金融危機以後,公共財產在國民財富中的占比卻似乎有所增長。
若找個天然資源豐富、且坐擁龐大主權財富基金的國家,譬如挪威,來跟中國比較看看公有財富在國民財富中的占比,會是非常有趣的一件事。一經比較,這兩個國家其實像是互換位子似的,中國的公有財富占比從1978的70%掉到2015年的30%,而挪威在這段期間則是由30%升至60%。中挪兩國的公有財富有一大差異,那便是挪威多將公有財富投資海外。
挪威龐大的公有財富淨額所產生的資本收入,主要用於進一步積累國外資本,長遠來看,此舉幫助政府减少稅負,並且得以規劃更多公共支出。由此可知,挪威公有財富的作用跟中國是大有不同。挪威的公有財富有其財政、金融方面的意義,而中國則是為了推動產業發展及維持政府對經濟的控制。不過,挪威的主權基金有時也會用於推廣特定政策,譬如社福和環境等相關政策。
中國的公有財富規模和結構,對於經濟發展有重大意義,因其規模有時會決定國家能否有效推動產業及區域發展,但也有時影響幅度較小。除此之外,公有財富的多寡也有財政上的意義,因為若是公有財富淨額為負,政府往往必須先支付巨額利息,才能進一步規劃公共支出和福利輸送,而若是政府坐擁大筆公有財富淨額,則能獲得大量資本收入,比起單純抽稅,更能進一步推動公共開支。
簡單來說,在1978年到2015年這段期間,中國已於私有財產制這條路上大有進展,但整體財產制度仍與世上其他國家相當不同。中國已不再是共產國家,但也還未進入資本社會,或許較準確的說法,應是一個頗具公有制特色的混合經濟體。
所得不均(1978-2015)
皮凱提、楊利及祖克曼等人結合近來公布的高所得者之所得稅數據、家庭收支調查,以及國民經濟會計帳,提出了針對所得不均的全新估算報告。據他們所知,這是首次有人用高所得者的稅務資料,來修正中國的所得不均數據。
1980年起,中國便課徵起了所得稅,但很長一段時間都沒有詳細的稅務資料可供參考,因此學者僅能仰賴家庭收支調查,研究各家各戶自行填寫、回報的資料。2006年,中國稅務機關發布通告,要求課稅所得額(taxable income)高於12萬元人民幣的納稅人要特別申報,並進一步公布這些人的稅務資料 註更多根據通告,課稅所得額為薪資所得、營業所得,加上課稅資本所得(taxable capital income)的總數減去扣除額(估計平均為預扣財政收入之20%,因此12萬元人民幣的課稅所得額門檻,約相當於15萬元人民幣的財政收入門檻)。中國的所得稅共分為三個部分,薪資所得、營業所得和資本所得是分開課稅(薪資所得從0%起至45%,採累進稅率;營業所得從0%起至35%,採累進稅率;資本所得則採統一稅率,多半落在20%),因此除非是2006年通告的情形,否則人民多半不必申報總課稅所得額。該通告的目的是要改善稅收,並且打擊貪腐情事。。
自2006年至2010年間,官方每年都會公布這些高所得者的財務統計資料,但2011年卻遭中斷。不過,這項通告至今仍然適用,而2011至2015年度的稅務資料,地方省分其實還是有公布。這幾名研究者於是廣納全國和地方的稅務資料,獲得不少高收入族群的資訊 註更多2006年至2010年間,課稅所得額高於12萬元人民幣的納稅人,約是全國城市成年人口所得的前0.5%(2006年高於前0.4%,2010年則低於前0.6%)。,而後參考、分析這些稅務資料,並大幅上修了現有的所得不均估算(見圖5)。
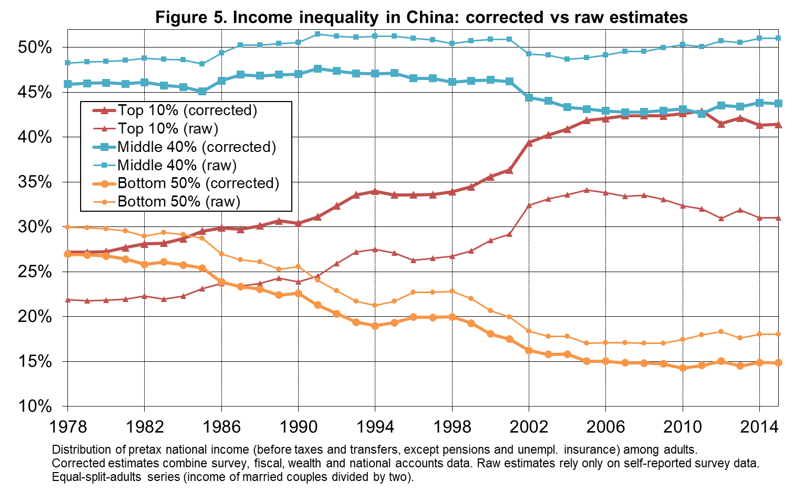
他們的分析指出,中國推動各項轉型之際,所得不均的情況也愈發嚴重。1978年,上層百分之十所得群體的所得僅占國民所得的27%,但到了2015年,此一比例卻高升至41%,而與此同時,下層半數人口所得群體的所得占比也從27%掉到15%。
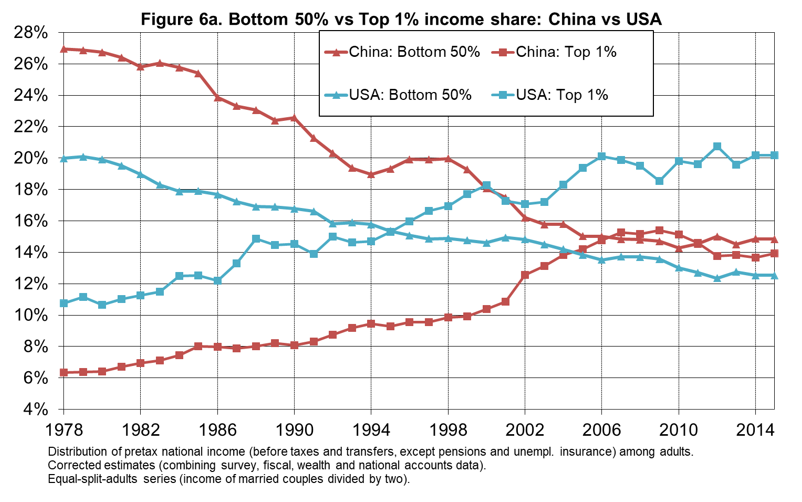
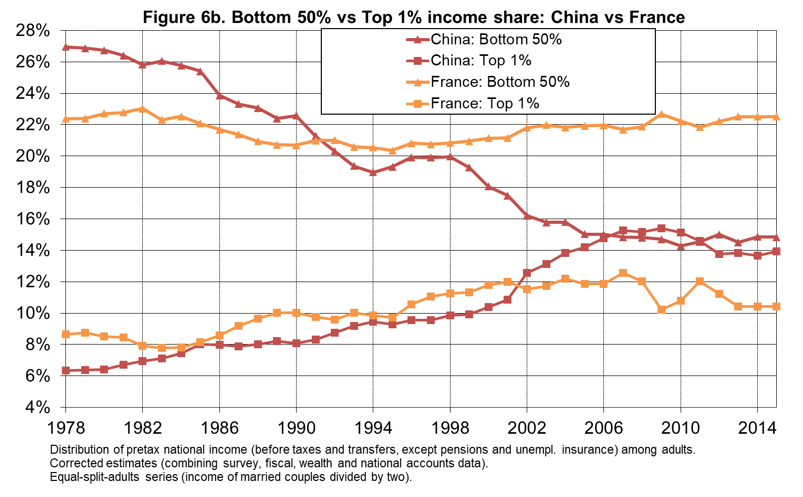
除此之外,城鄉的所得差距也不斷增加,就連城市與鄉村本身的財富集中化情況都是顯著上升。總結來說,中國在1970年代末期的時候,所得不均的程度比歐洲平均來得好。若真要說,還比較接近咸認最為平等的北歐國家。不過,時至今日,中國的所得不均情況,已經幾乎變得跟美國一樣糟糕。中國下層半數人口所得群體的所得約占國民所得總額的15%,而美國和法國則分別為12%跟22%,而中國上層百分之一所得群體的所得約占國民所得的15%,美國和法國分別是20%跟10%(見圖6a和6b)。
若比較一下1978年至2015年之間,中美法三國不同所得群體的實質人均稅前所得之年均成長率(見圖7),中國所得分配位於上層百分之一的人每年增長8.4%,美國為3%,而法國則為1.4%。然而,中國跟美國下層半數人口的所得群體,年均成長率都是顯著低迷,分別是4.5%跟0%,而法國則是0.9%。以目前情況看來,中國的發展模式似乎比美國更為平等,但卻仍不如歐洲國家。
不過,雖說不是每個中國人都能平等地享受到經濟成長的果實,但經濟大幅成長一事,也已大大提升了最貧困人口的生活水準,與此同時,美國絕大部分的經濟成長,則往往是為最頂層的人所掌握。
有趣的問題是,「公有制的沒落」跟「所得不均日益嚴重」這兩件事的關聯究竟有多強。我們不妨找個前共產國家,譬如俄羅斯,來跟中國比較看看。中俄兩國於經濟轉型時期,都曾經歷公共財產占比降低的情況,而所得不均的情形,更是打從兩國轉向市場經濟時便顯著上升。
然而,如圖8所示,俄羅斯的所得不均情事更為明顯跟立即,而中國則較為有限、緩進。中俄之間的差異,多少反映了兩國不同的私有化策略。中國採行的是較緩進的私有化策略,政府至今仍是企業資產的最大股東,而這點限制了財富集中化的速度。
俄羅斯則是沒有事先協調,反而躁進地採取「震盪療法」(shock therapy),導致經濟轉型為之「震盪」。在俄國如此混亂的貨幣政策及政治生態下,有一小群人得用相對低廉的價格,購入大量股權憑證(voucher),並跟當局達成利潤豐厚的交易案,譬如著名的「貸款換股權協議」(loans-for-shares agreement),便促成了不少這般交易。除此之外,再加上資本外流和境外基金增加,種種情形很可能促使俄羅斯成為今天的樣子,不但所得水準極端,財富分配也是極其集中。
由此來看,中國混合經濟的架構,可能減緩了所得不均的情況。然而,研究者也指出,若想量化分析中國公共財產、稅收、公共服務及福利等支出,如何影響到所得分配的情形,此刻尚窒礙難行,恐要留待未來的研究討論、解決。(翻譯:吳侑達)
楊利撰稿原文:
For Up-media (Taiwan) only. The article will be translated and published in Chinese only.
Author Li Yang
Capital Accumulation, Private Property, and Inequality in China, 1978-2015
Between 1978 and 2015, China has moved from a poor, underdeveloped country to the world’s leading emerging economy. Despite the decline in its share of world population, China’s share of world GDP has increased from less than 3% in 1978 to about 20% by 2015 (see Figure 1). According to official statistics, real national income per adult has grown more than eightfold between 1978 and 2015. While average national income per adult was approximately EUR 120 per month in 1978 (expressed in 2015 euros), it exceeded EUR 1 000 per month in 2015 (see Figure 2).
However, relatively little is known about how the distribution of income and wealth within China has changed over this critical period. To be more precise, there is no consistent estimates of the extent to which the different income and wealth groups have benefited (or not) from the enormous macroeconomic growth. The household surveys that are used to study distributional issues in China suffer from massive under-reporting, particularly at the top of the distribution, and are typically not consistent with the data sources that are used to measure macro growth (namely, national accounts). This is an issue of tremendous importance not only for China and its future development path, but also for the rest of the world and the social sustainability of globalization.
Wealth accumulation (1978-2015)
In the recent research, Thomas Piketty, Li Yang, and Gabriel Zucman combine official and non-official sources (including independent estimates of China’s balance sheets) to provide the first systematic estimates of the level and structure of China’s national wealth since the beginning of the market reform process.
Since 1978, China embarked on a managed transition that involved the step-by-step introduction of elements of capitalism, instead of seeking to directly convert its state-owned, planned economy into a private, market-based one. The transition has involved gradual but nevertheless wide-ranging reforms. The reforms were implemented progressively, from special economic zones in coastal cities towards inland provincial regions, and in sectoral waves. The transition brought about large rises in the countries’ private wealth as a proportion of national income (private wealth-income ratios). Since the time of the “opening-up” policy reforms in 1978, the private wealth-income ratio in China has more than quadrupled, reaching 490% of national income in 2015, (see Figure 3).
In contrast public wealth as a proportion of national income (public wealth-income ratio) in China has remained relatively stable since 1978 at around 250%. Consequently, the share of public property in national wealth has declined from about 70% in 1978 to about 30% in 2015. More than 95% of the housing stock is now owned by private households, as compared to about 50% in 1978. Chinese corporations, however, are still predominantly publicly owned: close to 60% of Chinese equities belong to the government (with a small but significant rebound since 2009), 30% to private Chinese owners, and 10% to foreigners—less than in the United States, and much less than in Europe (See Figure 4).
Interestingly, many high-income countries have also experienced a similar decline in the share of public property since the 1980s, due both to the rise of public debt and the privatization of public assets. The share of public wealth in China today is not incomparable to levels observed in Western high-income countries during the “mixed economy” period (1950-1980). In effect, the share of public property in China today (30%) is higher than in the West during the mixed economy regime of the post-World War 2 decades (around 15%-25%), but not hugely so. And while the share of public property in national wealth has declined to 0% or even less than 0% in Western countries (with public debt exceeding public assets in the United States, Britain, Japan, and Italy today), the public’s share of national wealth in China seems to have strengthened since the 2008 financial crisis.
It is interesting to compare the evolution of the public share in national wealth in China and a resource-rich country with a large sovereign wealth fund such as Norway. These two countries have essentially switched positions: while the public share in Chinese national declined from 70% to 30% between 1978 and 2015, while it rose from 30% to 60% in Norway over the same period. A key difference between public wealth in Norway and China is that most of Norway’s public wealth is invested abroad. Norway’s large positive net public Wealth generates capital income that is mostly used to finance further foreign capital accumulation, which in the long-run can be used to reduce taxes and to finance more public spending. In that sense, it is a very different form of public property than in China. Norwegian public property has therefore largely been accumulated for fiscal and financial purposes, rather than for industrial development and retaining a measure of control over the economy as seen in China. Norway’s sovereign fund has, however, also been used at times to promote certain policies, for example, regarding social and environmental objectives.
The size and structure of China’s publicly-held wealth assets has large implications for economic development. the size of public property has important consequences for the state’s ability to conduct industrial and regional development policies; sometimes more efficiently and sometimes less so. It also has potentially considerable fiscal consequences, as governments with negative net public wealth typically have to pay large interest payments before they can finance public spending and welfare transfers, while those with large positive net public wealth can benefit from substantial capital incomes, enabling them to finance more public spending than could be possible through tax collection.
In brief: China has moved a long way toward private property between 1978 and 2015, but its property regime is still markedly different than in other parts of the world. China has ceased to be communist, but is not entirely capitalist; it should rather be viewed as a mixed economy with a strong public ownership component.
Income inequality (1978-2015)
By combining recently released tax statistics on high-income individuals with household surveys and national account data, Thomas Piketty, Li Yang, and Gabriel Zucman provided new estimates of income inequality, which, to the authors’ knowledge, represents the first attempt to use tax data on high earners to correct inequality statistics in China.
An income tax has been in place in China since 1980, but until recently no detailed income tax data was available, and scholars therefore had to rely on household surveys based upon self-reported information. In 2006, the Chinese tax administration issued a circular requiring all taxpayers with individual taxable income above 120,000 yuans to file a special declaration, and it started to release the number of such taxpayers and their taxable incomes. These new fiscal statistics on high earners were released annually at the national level from 2006 to 2010, but the publication was interrupted in 2011. The circular, however, still applies today, and for income years 2011 to 2015 publication of the data continued at the provincial level (sometime with additional information on taxpayers with incomes above 500,000 yuans and 1 million yuans). The authors collected both national and provincial tabulations, which together provide useful information about top incomes. Relying on these tax tabulations, the author made significant upwards correction on the existing inequality estimations, which are mainly based on survey data (see Figure 5). .
According to their series, income inequality increased markedly in China as she made her respective transitions. The share of national income going to the top 10% rose from 27% to 41% between 1978 and 2015, while the share for the bottom 50% fell from 27% to 15%. The urban-rural income gap increased, but income concentration also rose significantly within both urban and rural China . To summarize, the level of inequality in China in the late 1970s used to be less than the European average – closer to those observed in the most egalitarian Nordic countries – but they are now approaching a level that is almost comparable with the USA. The bottom 50% in China earn approximately 15% of total national income versus 12% in the USA and 22% in France; while the top 1% earns about 15% of national income, versus 20% in the USA and 10% in France (See Figure 6a and 6b).
Comparing the average annual growth rate of real per adult pre-tax national income for different income groups in China, U.S. and France from 1978-2015, as shown in Figure 7, the top 1% of the income distribution experienced a growth rate of 8.4% in China, 3.0% in the USA, and 1.4% in France. However, the average annual growth rates for the bottom 50% in China and the US are significantly lower at 4.5% and 0% respectively, while the same figure was 0.9% in France. For the time being, China’s development model appears to be more egalitarian than that of the United States, but less than that in European countries. Although in China growth has not been equally shared, the outstanding growth experienced has lifted the living standards of the poorest very substantially, while the bulk of the growth in USA has been mainly captured by those at the very top.
An interesting question is the extent to which the declining of the public ownership and rising income inequality are related. An interesting case is to compare China with former communism countries, especially Russia. Both Russia and China have experienced the same decline in the share of public property during their economic transition, while income inequality has increased markedly in both countries since the beginning of their respective transitions toward market-orientated economies. However, the rise of inequality was much more pronounced and immediate in Russia, and was more limited and gradual in China (See Figure 8). The evolution of income inequality in China and Russia partly reflects the different privatization strategies pursued in the two countries. The gradual privatization process in China—where the government is still the majority owner of corporate assets—has limited the rise of income concentration. In Russia, the uncoordinated and rapid shock therapy transition process was particularly abrupt. Within the chaotic monetary and political context of the Russian transition, small groups of individuals were able to amass large quantities of vouchers at relatively low prices, and obtained highly profitable deals with public authorities (e.g., via the loans-for-shares agreements). Together with capital flight and the rise of offshore wealth, this process is likely to have led to the extreme levels of income and wealth concentration we now see in Russia.
In this sense, China’s mixed economy structure might contribute to mitigating the rise of inequality. However, based on the author, a quantitative analysis of how public property, taxes, public services, and welfare spending shape the distribution of income in China can only be addressed in future research.

熱門影音


熱門新聞
- 《淚之女王》金智媛、金秀賢互飆演技收視破20% 「洪海仁墓碑」劇照瘋傳網憂BE結局
- 《蓮花樓》成毅新劇高馬尾造型曝光帥翻 憑2關鍵奪回藝名聲勢輾壓師兄任嘉倫
- 【《承歡記》內幕曝光】楊紫片酬拿2億演技卻被罵翻 許凱演霸總9千萬輕鬆入袋
- 《與鳳行》林更新公開女友惹怒CP粉 趙麗穎親上火線17字幫忙救場超暖心
- 【韓星片酬大公開】金秀賢拍《淚之女王》因「這理由」降價演出 IU身價輾壓宋慧喬
- 肖戰新劇凝視《惜花芷》張婧儀畫面曝光甜出汁 新片與《在暴雪時分》趙今麥演兄妹超吸睛
- 《慶餘年》第二季5月播出全網沸騰 「他」接演肖戰角色2關鍵被看衰
- 白敬亭拍趙露思《偷偷藏不住》姐妹作制服照曝光 「這關鍵」帥度不敵陳哲遠

熱門分享


-
世代傳媒股份有限公司

上報UP Media 於2016年7月成立。我們集結菁英記者、編輯、專業行銷業務、社群好手,強調多元的原生內容與有趣豐富的觀點。我們有國內外調查新聞、生活、遊戲、消費等資訊,希望提供讀者具有深度、廣度、樂趣及生活、時尚品味的原生新聞。
瞭解更多→ -